


Experience the Power of VT 12
When you are trading, you want to understand what’s happening in the market and at the same time, see the best possible opportunities brought to your attention. I call it “Situational Awareness” and that’s how VisualTrader provides a significant edge to those who use it.
VisualTrader is the only trading software based on (a) industry group rotation, (b) multiple time frame views of the data, and (c) the ability to see the relationship between multiple indicators in a 3-D display.
This information instantly shows which groups are the strongest, and which stocks within those groups have the best setups. Here is a good overview of how VisualTrader condenses and displays this important information.
VisualTrader 12 builds on this foundation by adding Zacks Ranking and Multiple Timeframe Analysis, greatly boosting VisualTrader’s inherent profitability with even more actionable information!
The Best Features from OmniTrader
For VisualTrader 12, we examined the best features that have been recently added to OmniTrader and added those that could make a big impact to VisualTrader.
VisualTrader already provided the ability to see the relationships between multiple timeframes in the List, but now it has the ability to analyze them in the Charts, thanks to the Multiple Timeframe Analysis feature.
MT Analysis can also be Dynamic, showing the value of a higher timeframe that “shifts” in time as you move forward in the lower timeframe, rather than waiting an entire week to pass before changing. It’s explained here.
The Fibonacci Retracement tool is a powerful addition to VisualTrader 12. There are also the ability to show indicators behind price bars (useful for shaded indicators like Ichi Moku), and more great features as described here.
Harnessing the Power of Zacks Ranks
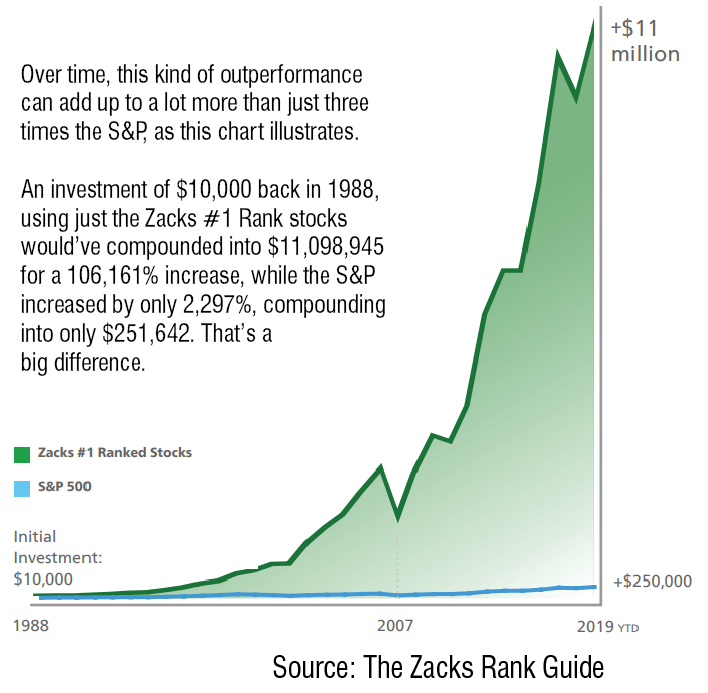
For over 30 years, Zacks has been ranking stocks based on changes in earnings rank and other factors. Just investing in the Zacks #1 Ranked Stocks since 1988 would have yielded returns that are DOUBLE those of the S&P 500 over the same period. See here!
Zacks Ranks make it easy to see where any symbol stacks up against over 4,000 stocks analyzed by the Zacks system. The Zacks Rank can also be used to dramatically improve the performance of existing Strategies – or create new ones.
Zacks Strategy Suite
For VisualTrader 12, we took advantage of the power of Zacks Rank to create several new Strategies that are showing great profitability – so much so that they can be used as the primary means of signaling great candidates to consider for trading each day, because the Rank is built into the Strategies! See them in action!
A VisualTrader Powerhouse!
VisualTrader users already know how easy VT makes finding great trades in any market. VisualTrader 12 makes it even easier with the addition of Zacks Ranks and MT Analysis. Add the additional power features, and especially the new Strategies, and you have a tremendous upgrade. If you liked VT before, you are going to LOVE this version. Visualize success, with VisualTrader 12.
Sincerely,
Ed Downs
The Zacks Rank
Trading Advantage
The Power of The Zacks Rank
In 1978, Zacks Founder and CEO hit upon a key discovery: earnings estimate revisions are the most powerful force impacting stock prices. With this crucial finding, he developed the Zacks Rank to harness the power of earnings estimates.
For more than a quarter century, Zacks #1 Rank Stocks have more than doubled the S&P 500 with an average gain of +24.62% per year. These returns cover a period from January 1, 1988 through November 4, 2019.
The Zacks #1 Rank stocks are ideally suited for folks who rely on momentum or technical analysis because it can tip them off before most other systems. The Zacks #1 Rank is about “cause and effect”. The cause of the move is positive revisions in earnings estimates. The effect of an upward shift in earnings estimates prompts more investors to take an interest in the company, pushing prices higher.
Zacks #1 vs. The S&P 500

The 5 Zacks Ranks

The Power of Zacks Rank
Given the sheer number of earnings estimate revisions made on a daily basis, it can be very difficult to determine which stocks to buy and which ones to avoid.
The Zacks Rank solves this problem by helping investors harness the power of earnings estimate revisions to trade and invest more successfully.
The Zacks Rank is a proprietary stock-rating model that uses trends in earnings estimate revisions and EPS surprises to classify stocks into five groups as shown to the left. The historical average annual return for stocks in each Rank are also shown.
Zacks Industry Rank
The Zacks Industry Rank is also updated daily, and is based on average ranks of all the stocks in each of the 265 industry groups. The best stocks in the best groups are particularly set to move higher.
The 5 Zacks Ranks
The Power of Zacks Rank
Given the sheer number of earnings estimate revisions made on a daily basis, it can be very difficult to determine which stocks to buy and which ones to avoid.
The Zacks Rank solves this problem by helping investors harness the power of earnings estimate revisions to trade and invest more successfully.
The Zacks Rank is a proprietary stock-rating model that uses trends in earnings estimate revisions and EPS surprises to classify stocks into five groups as shown to the left. The historical average annual return for stocks in each Rank are also shown.
Zacks Industry Rank
The Zacks Industry Rank is also updated daily, and is based on average ranks of all the stocks in each of the 265 industry groups. The best stocks in the best groups are particularly set to move higher.
Harnessing The Power of Zacks Rank
ONLY in
VisualTrader 12
Knowing the Zacks Rank on any stock we are considering trading can provide a huge advantage.
There are many uses of the Zacks Rank in VisualTrader, including The List, OmniScan and in the new Strategies.
In the List
A column in the VisualTrader List shows the most recent value of the Rank, as calculated each day by Zacks. This provides valuable additional information about which Symbols are likely to perform.
The four symbols shown to the right were near the top of the VisualTrader List, AND ALSO ranked #1 by Zacks. The strength in these charts and moves that followed are self-explanatory!
In OmniScans
In addition, the Zacks Rank can easily be used in OmniScan to ONLY retrieve those symbols that have a “1” or “2” Zacks Rank. This yields the most powerful list possible, ready to be analyzed by the many other great tools in VisualTrader 12.
NEW! Nirvana’s Zacks Rank Strategies
The NEW Zacks Rank Strategies (ZRS) in VisualTrader 12 have Zacks Rank built in and will only fire a Signal if a given rank is present – 1 or 2 for Longs and 0 or 5 for Shorts.
This simple idea has given us some breathtaking performance in VisualTrader. To the right are several charts with the Zacks Rank Strategies employed.
These strategies perform well without the Zacks Ranking, but by adding the Zacks Ranking as a filter, we are seeing exceptional results!

The Zacks Rank Strategies find prime entries in the highest ranked stocks.
This chart for CMCSA shows the strong moves following signals from the ZRS Long Strategies.
This chart for CMCSA shows the strong moves following signals from the ZRS Short Strategy.
A Statistical Edge
Using Zacks Ranking as a strategy filter, we see a significant increase in accuracy and profitability.

The Zacks Rank Strategies find prime entries in the highest ranked stocks.
This chart for CMCSA shows the strong moves following signals from the ZRS Long Strategies.
This chart for CMCSA shows the strong moves following signals from the ZRS Short Strategy.
NEW! Nirvana’s Zacks Rank Strategies
The NEW Zacks Rank Strategies (ZRS) in VisualTrader 12 have Zacks Rank built in and will only fire a Signal if a given rank is present – 1 or 2 for Longs and 0 or 5 for Shorts.
This simple idea has given us some breathtaking performance in VisualTrader. To the right are several charts with the Zacks Rank Strategies employed.
These strategies perform well without the Zacks Ranking, but by adding the Zacks Ranking as a filter, we are seeing exceptional results!
A Statistical Edge
Using Zacks Ranking as a strategy filter, we see a significant increase in accuracy and profitability.
Use Zacks Rank to
Improve ANY Strategy!
Click Here for full story
The Unique Features that Makes VT
the Most Powerful Platform on The Planet
The Lists provide a sortable view of the information in the Map. All windows, including the Lists, can be made transparent or translucent, which means you can still see the Map behind them, giving you an optimized view of all the information.
Green and Red bars in the List correspond to Green and Red Cylinders in the Map. By sorting on this information, you can instantly find Groups or Symbols that are gaining strength or weakness.
The “Prime Opportunities”
Move to the Top
The “Prime Opportunities”
Move to the Top
The Lists provide a sortable view of the information in the Map. All windows, including the Lists, can be made transparent or translucent, which means you can still see the Map behind them, giving you an optimized view of all the information.
Green and Red bars in the List correspond to Green and Red Cylinders in the Map. By sorting on this information, you can instantly find Groups or Symbols that are gaining strength or weakness.
Click the Above column to bring the tallest Cylinders (strongest stocks) to the top. Click the Below column to bring the tallest Cylinders below the Map to the top (the weakest stocks).
Enable the Auto-Sort feature and the List will sort itself in real time, automatically bringing candidates to the top as the information in the Map changes.
There are 3 buttons at the top of the List; Groups, Symbols and Both. Click Groups to get a streamlined List of the Groups with only Group composite charts displayed when clicked. Click Symbols to see a List of Symbols only. The most powerful view is that obtained using the Both button.
In this view, the List is arranged according to Industry Group with Symbols in the Group. In this example to the left, the Homebuilder and Trucking Groups rose to the top, indicating they are the strongest Groups right now.


Incredible Firepower
On this page is an example of how VisualTrader’s List
and Map work together to help you find and trade the best opportunities. On January 23, Homebuilders and Trucking moved to the top of our Upper List. The Trucking Group had the most Buy Signals and Patterns, so we focused on that Group.
ABFS was at the top of the Group, with a Buy Signal and a Bullish pattern dot. Looking at the chart, we confirmed the Trend Line Break pattern. We now have everything going for us on this trade—market turning up, Group very strong, with a Signal and confirming pattern in the stock chart. Over the next week, ABFS rose more than 25%.
Incredible Firepower
On this page is an example of how VisualTrader’s List and Map work together to help you find and trade the best opportunities. On January 23, Homebuilders and Trucking moved to the top of our Upper List. The Trucking Group had the most Buy Signals and Patterns, so we focused on that Group.
ABFS was at the top of the Group, with a Buy Signal and a Bullish pattern dot. Looking at the chart, we confirmed the Trend Line Break pattern. We now have everything going for us on this trade—market turning up, Group very strong, with a Signal and confirming pattern in the stock chart. Over the next week, ABFS rose more than 25%.
The Best Features from OmniTrader...
Brought to Life in VisualTrader 12
Multiple Timeframe Analysis
We already had the ability to show indicator values from other timeframes in the VisualTrader List. Now we can see it in the charts!
The new Multiple Timeframe Indicators feature substantially extend VisualTrader’s analytic abilities. Now we can plot any indicator from any timeframe in any chart. For example, we can plot the Weekly RSI and Daily RSI together in the Daily Chart.
Dynamic Indicators
Dynamic Indicators in higher timeframes adjust as the lower timeframe moves forward. As shown in the example to the right, the standard Daily value is based on the previous session. Obviously, that means there is just one value for each day.
For Dynamic Daily, we calculate the prior day’s bar on every 5 minute bar. This provides the benefit of the Daily view, with the additional benefit of capturing changes that happen in the CURRENT session!
A good demonstration of the benefit of this is shown in the charts to the right. On October 14th, Wal-Mart reverses trend and momentum and falls throughout the trading session. The top chart showing the Daily Indicator using the previous day’s value is still showing rising momentum.
But the bottom chart shows how the Dynamic Daily Indicator reacts to falling price and provides you with much more valuable information.
The benefit of this is clear when you calculate indicators dynamically. They show the effect of sudden price changes as new data is received without losing the benefit of the higher timeframe information.
Smart Compiling
Compiling now only occurs when it needs to on an individual file basis. If VisualTrader detects that a new file is installed or has been modified, it knows to compile only what’s needed. When you click “Compile” in OmniLanguage it ONLY compiles what has changed! For many users this single improvement can save HOURS!
Nirvana Club Members – Great news! ARM6 now works in VisualTrader!

Hollow Candle Charts
VisualTrader 12 includes the “Hollow Candle” template
used by many traders.
Improved Default Settings
We have revised “defaults” to values that most users
want to use, such as added two New Strategies to the
install: One System Strategy + Filter by Indicator and
updated Strategy Templates.
Adjustable Signal Size
Now you can set your Signals to be up to 10x the default size.
Also New in VisualTrader:
New and Improved Fibonacci Tool
Fibonacci Levels are one of the most powerful tools you can add to any chart. Place the tool in your chart from a recent HIGH to a LOW and let the Fibonacci Levels guide you as you trade the chart. Look at how well the chart reacted to the lines in this chart.
It’s also 100% Customizable. It comes with default levels that are widely recognized by traders, but you can change them to any you would like to use and define up to 10 levels. The new tool shows both price and retracement value.
Notes in Strategies
It’s easy to forget edits you’ve made to Strategies.
Now, you can add Notes.

Also New in VisualTrader:
New and Improved Fibonacci Tool
Fibonacci Levels are one of the most powerful tools you can add to any chart. Place the tool in your chart from a recent HIGH to a LOW and let the Fibonacci Levels guide you as you trade the chart. Look at how well the chart reacted to the lines in this chart.
It’s also 100% Customizable. It comes with default levels that are widely recognized by traders, but you can change them to any you would like to use and define up to 10 levels. The new tool shows both price and retracement value.
Notes in Strategies
It’s easy to forget edits you’ve made to Strategies. Now, you can add Notes.
Hollow Candle Charts
VisualTrader 12 includes the “Hollow Candle” template used by many traders.
Improved Default Settings
We have revised “defaults” to values that most users want to use, such as added two New Strategies to the
install: One System Strategy + Filter by Indicator and updated Strategy Templates.
Adjustable Signal Size
Now you can set your Signals to be up to 10x the default size.
New for VisualTrader 12!
We Implemented Zacks Rank on both Stocks and Industry Groups in VisualTrader with amazing results.
Just Add Zacks!
In VisualTrader 12, it is easy to add Zacks Rank to ANY OmniTrader Strategy using a simple Filter. VT ALSO collects and saves historical Zacks Ranks* which are used in Strategy testing.
We did this with a number of Strategies, and were surprised and pleased at the results.
In all cases, adding Zacks Rank boosted PPT significantly. In one case it was a whopping 400%! See table below!
An Enormous Value
The ability to use Zacks Rank in Strategies is perhaps the most powerful application of the ranking data. Use Zacks Rank to improve any existing Strategies you have to make them perform better!
* Zacks Rank History has been collected since July 2019, and continues to be updated on
our servers.
VisualTrader 12
Upgrade
Order by December 24th and Save!
VisualTrader 12
Upgrade
Order by December 24th and Save!
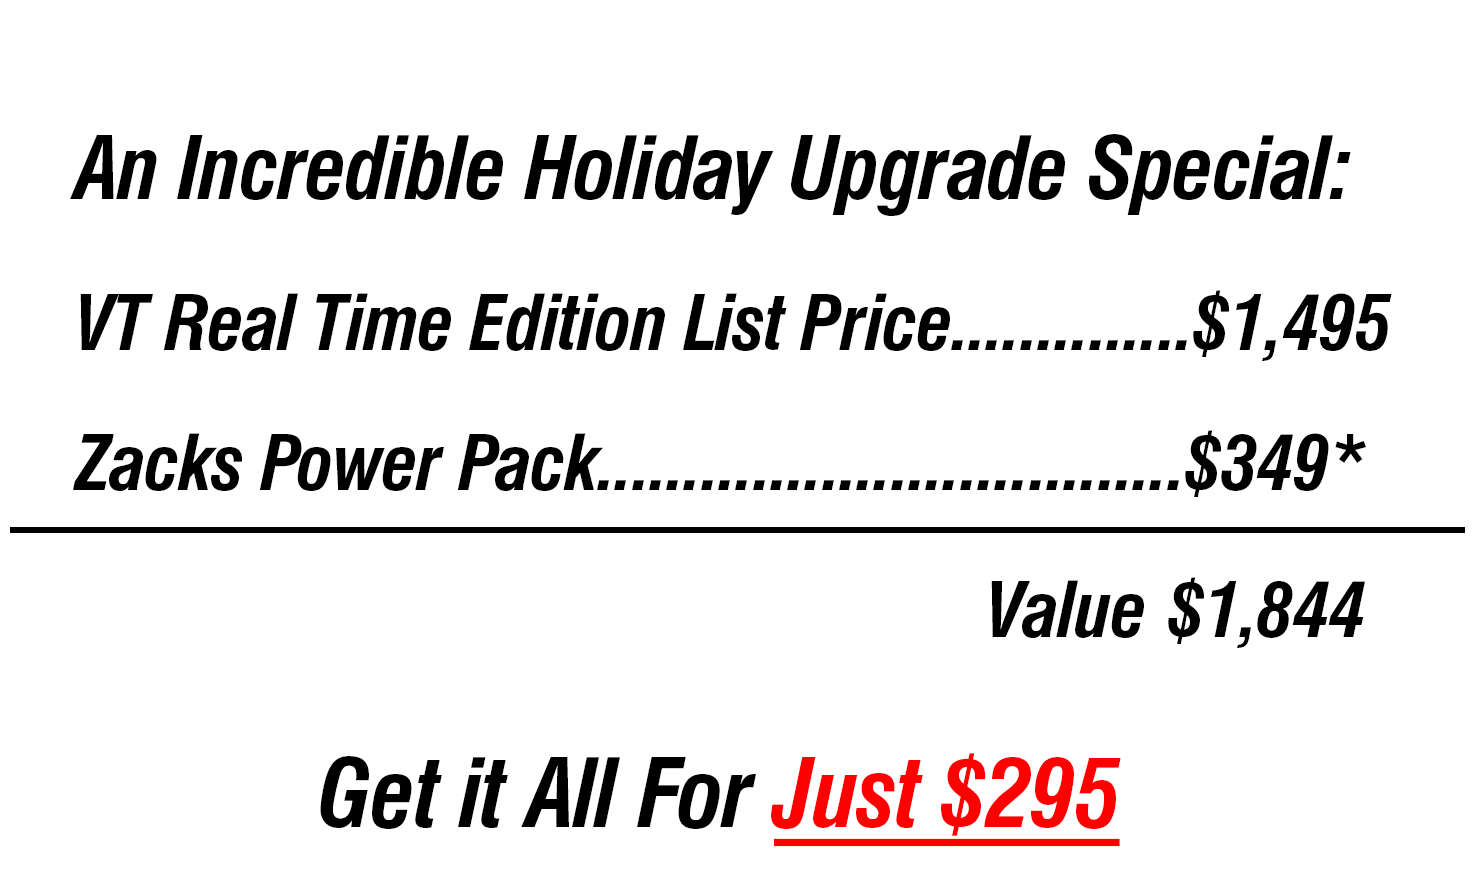

*The Zacks Power Pack includes Zacks Ranks and Industry Ranking for six months.
After six months, you can continue to get Zacks and Rank and Industry Ranking for only $10/month.